

Resonating Cycles as a Potential Source of Alpha

For my subscribers who follow my Snowball account, this article is a rehash of my former article on this subject. I notice these thoughts haven’t been made available on Substack, therefore making it difficult to reference in future investor letters. Miniscule and anonymous as I am, I hope to contribute some of my own ideas to the investment society. “Resonating Cycles”, coupled with “Divergent Expectation”, form my “water based”, Taoist philosophy of portfolio management, varying between diversification and concentration based on edge and probabilities to exploit market inefficiencies and attempt to deliver satisfactory risk-adjusted returns. Everyone’s investment philosophy is at least partially path dependent and therefore necessarily limited in scope, and the idea of resonating cycles also dynamically evolves as I collect more data through my personal investment experiences. In one way or another, behind every investment I make, I intuitively ask myself which cycles are at work, and how are these cycles likely to evolve. For my ex-China subscribers who have not read it before, please feel free to leave your thoughts/critique or discuss any points of your interest through private correspondence. Should I have the time and opportunity, I’d love to dive deeper into some of the unanswered aspects of my reviewed academic research to satisfy my own intellectual curiosity. Finally, in the supplementary materials, I include resonating cyclical cases I have successfully taken advantage of, and also include a letter that delineates my thought process of buying/adding M&T Bank and Citizen Financials in Oct 2023 in addition to my earlier investments in the preferred-A series of Western Alliance Bank and Webster Financial. Thank you for reading in advance.
Abstract
My article examines resonating cycles as a potential source of investment alpha, emphasizing the value of understanding cyclical patterns at varying levels of granularity. It organizes these cycles into five categories: global financial, financial and business, industrial and sentiment, corporate, and capital structure cycles. By identifying points where multiple cycles converge into resonating troughs, the article provides a roadmap for exploiting these phenomena in investment strategies. Drawing on a blend of academic research and practical experience, it discusses the predictive power and interconnectedness of these cycles, exploring themes such as global financial flows, financial cycles’ influence on recessions, and the relationship between industrial dynamics and market sentiment. Additionally, I elucidate opportunities and structural mechanisms behind different layers of a company’s capital structure, and illustrate ways that such mispricing can be taken advantage of. The study concludes by encouraging further analysis into currently conflicting views under academic settings, and better disentangle the interactional forces of these cycles to arrive at ways to exploit alpha in a systematic fashion.
Introduction
Cycles are like sunrises and sunsets – they are certain to happen, although less predictable at times. Despite its frequent lack of predictability, cycles, in my view, are easier to take advantage of than predicting sustainable growth. Some of the best investment opportunities I have encountered have been cyclical plays, and the best of the best are those with resonating cycles – namely multiple cyclical patterns creating a resonating trough. To better understand cycles is to better prepare oneself for the inevitable, and to better take advantage of such inevitabilities.
Global Financial Cycles
The importance of the Global Financial Cycle to countries (especially emerging ones) have been argued by scholars. For instance, Rey (2015) argues that “there is a global financial cycle in capital flows, asset prices, and in credit growth. This cycle co-moves with the VIX, a measure of uncertainty and risk aversion of the markets” (p. 17). Passari and Rey (2015) wrote: “large gross cross-border flows are moving in tandem across countries regardless of the exchange rate regime, they tend to rise in periods of low volatility and risk aversion and decrease in periods of high volatility and risk aversion, as measured by the VIX… There is a global financial cycle” (p. x).
Nevertheless, by analyzing foreign direct investment (FDI), portfolio equity investment, portfolio debt investments, and bank credit as capital flows and VIX, VSTOXX, IVI, and VDAX as proxies for global financial cycles, Cerutti, Claessens, and Rose (2017) failed to find a correlation. Without considering endogenous domestic responses to global financial cycles, their results suggest that the global financial cycles explains only a small fraction of the variation in capital flows, then more idiosyncratic phenomena necessarily explain capital flows. My guess is domestic responses partially mitigate such global capital flows, but more research needs to be done to tease out the effect of standalone global financial cycles. In addition, the authors did not investigate the impact of global financial cycles on domestic asset prices or credit, which are critical subjects of capital allocators -- these directions need further analyses as well. Based on existing literature, we know relatively little about the true impact of global financial cycles on domestic.
As a practitioner, based on my personal experience, I believe global capital cycles exist, although they can oftentimes be overwhelmed by country-specific idiosyncratic development. It would be interesting to conduct statistical tests on this subject.
Financial Cycles & Business Cycles
Minsky (1982) and Kindleberger (2000) define financial cycles as the self-reinforcing interactions between asset prices, risk, risk taking, and financing constraints. Some authors go as far as arguing that all recessions in the US since 1985 had financial origins (as cited in Ng & Wright, 2013). Financial cycles can be proxied by using bandpass filters with frequencies from 8-32 years to extract medium-term cyclical fluctuations in real (inflation-adjusted) credit, the credit-to-GDP ratio, and real property prices, which are averaged to derive a composite measure of the financial cycle (Drehmann, Borio, & Tsatsaronis, 2012). In addition, another powerful predictor of recession risk is the debt service ratio (DSR), defined as interest payments plus amortization divided by GDP. Drehmann, Juselius, and Korinek (2018) find a strong link between debt accumulation and subsequent debt service, which in turn has a large negative effect on growth. Financial cycles can be described by the joint behavior of leverage and the DSR. More importantly, scholars have found that for a panel of advanced and emerging market economies, financial cycle measures have significant forecasting power both in and out of sample, even for a three-year horizon, outperforming the term spread in nearly all specifications (Borio, Drehmann, & Xia, 2020). Business cycles become more fragile when financial booms develop, and typically one financial cycle entails two to three business cycles. However, even this study which employs global panel data focuses only from 1985 on. The authors noted structural differences for the 40 years before 1985 and after, and as practitioners we know a continuous easing of interest rate has been a structural theme for the last 40 years – are we entering a new paradigm with inflation and rates both stepping higher? Will the results produced by this study stand in the new paradigm? How would DSR, financial cycle, and business cycle interact before 1985? These questions remain unanswered by extant literature.
Industrial Cycle and Sentiment Cycle
Scholars have found that firms tend to compete more aggressively in financial distress; the intensified competition in turn reduces profit margins, pushing themselves further into distress and adversely affect other firms. The feedback imposes an additional source of financial distress costs incurred for raising leverage, which helps explain the negative profitability-leverage relation across industries. Owing to the contagion effect, in a decentralized equilibrium, leverage is excessively high from an industry perspective, compromising industry’s financial stability (Chen, Dou, Guo, & Ji, 2023). It applies to many industrial cycles that I have experienced, and its general mechanism can be summarized as above.

This is particularly true for the shale gas industry pre-pandemic – the producers were levered, and when gas price was under pressure, they produced more natural gas to ride down the cost curve, further depressing gas price, reducing free cashflow, and resulting in greater leverage. This model perfectly describes the down-leg of the last natural gas (and oil) cycle – the mechanism behind the evolution of that industry closely follows Chen’s prescription.

However, the model does not address the upcycle. Despite the prevailing contagion which culminated in a near-death experience for the natural gas patch in the US, the producers ultimately dropped enough rigs on a concerted effort, and natural gas price rebounded after Covid hits. In other words, with the contagion reaching a certain degree, from an industrial cycle point of view, the cycle cannot march any lower. Firms start to collaborate tacitly, and the tides start to turn, leading to remarkable upside potential. A more complete model wants to capture the entirety of the industry cycle under a single parsimonious framework. The fund I worked at during the past summer precisely capitalized on the lack of academic research on the upcycle to seize the trough of the previous natural gas bottom and loaded up on companies trading below net asset value (NAV), reaping substantial gains in the upswing. I believe more systematic and quantitative academic research can be done on this front to substantiate empirical results.
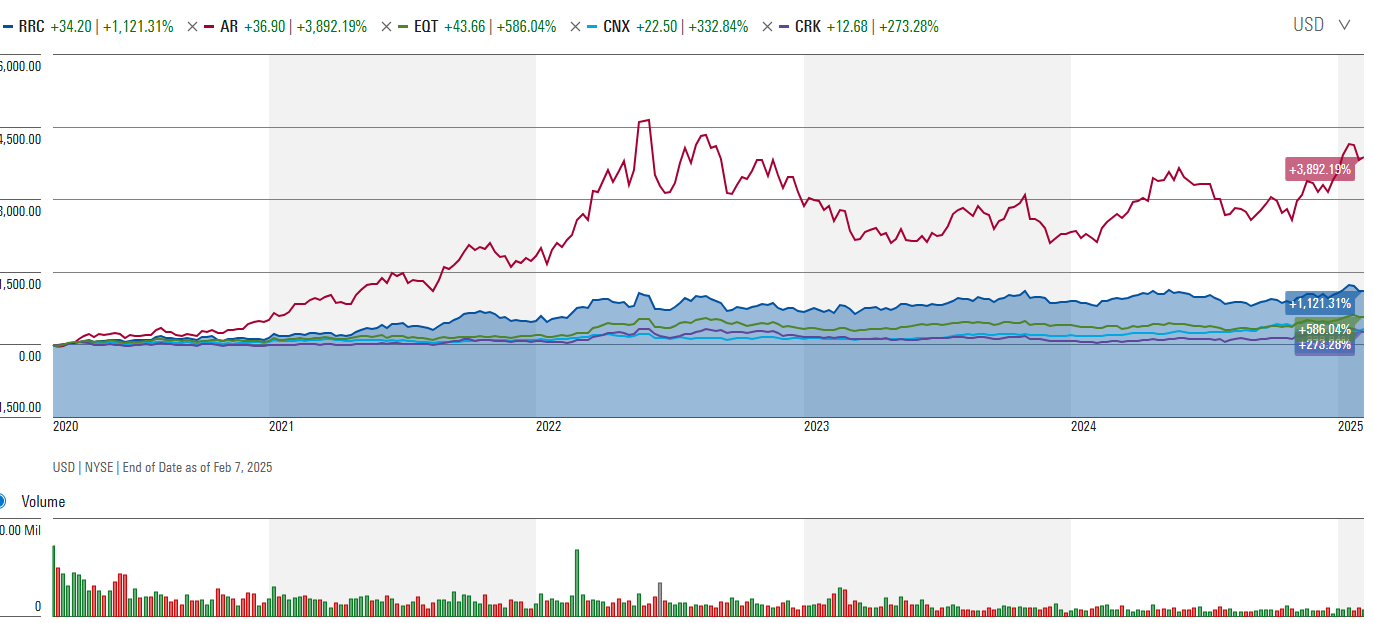
Figure 1. Performance of public, standalone natural gas producers after they hit the low in Mar, 2020.
Much of the price volatility is also driven by the sentiment cycle, which vastly exaggerates the industrial cycle. This is where Ben Graham believes one can exploit market inefficiencies through mispricing resulted from excessive emotions. Stambaugh et al (2012) find that long-short strategies that exploit the anomalies exhibit profits consistent with this setting. First, each anomaly is stronger (its long-short strategy is more profitable) following high levels of sentiment. Second, the short leg of each strategy is more profitable following high sentiment. Finally, sentiment exhibits no relation to returns on the long legs of the strategies (Stambaugh, Yu, & Yuan, 2012). This confirms Jim Chanos’ practical observation that historically the alpha on the short side has been as high as 15% in the last two decades, and has been even higher prior to that. Recently, however, he observes that the alpha on the short side has substantially diminished as a result of excessive liquidity by the Federal Reserve. Therefore, it will be interesting to reexamine Stambaugh’s work and extend it to consider the interaction between the alpha of the long-short strategy and market liquidity.
Corporate Cycles and Capital Structure Cycles
It has been well documented that there are arbitrage opportunity between the same company’s equity and debt given limited liquidity which results in limited arbitrage between equity and credit markets. Short horizon pricing discrepancies across firm’s equity and credit markets are common and that an economically significant proportion of these are anomalous, indicating a lack of integration of these two markets (Kapadia & Pu, 2012). Even for the US market, scholars has found and documented a nontrivial but imperfect integration between its stock and corporate bond markets (Sandulescu, Trojani, & Vedolin, 2021). Chen, Chen, and Li (2021) proposed a metric named the debt-equity spread defined as the difference between actual credit spread and equity-implied spread. The actual credit spread is calculated from observed bond prices, while the equity-implied credit spread is computed using equity market information through the lens of a standard structural credit risk model. When a firm’s equity is valued highly relative to its debt, the equity-implied credit spread tends to be low relative to the actual bond spread, resulting in a higher DES. High-DES firms tend to have more negative growth forecasting revisions (analysts being too optimistic in extrapolation of high growth), are more likely to issue equity and retire debt (Confirming Ma (2019)), and have more insider equity selling. The results are also stronger among smaller, less liquid, and more difficult-to-short stocks and bonds (Chen et al., 2021). This could lead to highly interesting opportunities to climb the capital structure ladder for the investors, and thereby selecting the best risk-reward among various types of financial instruments associated with the same company.
Some of the most dangerous yet also most lucrative opportunities exist due to debt overhang, and a deeper understanding of the interaction between macroeconomic risks and agency problems is critical. Scholars have found that firstly, recessions are times of high marginal utilities, which means that the distortions caused by agency problems during such times will affect investors more than in booms; secondly, corporate spreads are strongly countercyclical, thus for a given investment opportunity, the transfer from equity holders to debt holders in a typical procyclical firm tends to concentrate in bad times (Chen & Manso, 2017). In their benchmark case, the debt overhang costs for a low leverage firm peak at less than 0.5% of the total firm value without macroeconomic risk, while these costs peak at 2.7% or 3.6% in booms and recessions, respectively, in the presence of macroeconomic risk. For a high leverage firm, the debt overhang costs peak at 5.1% without macroeconomic risk, while these costs peak at 8.5% or 10.7% in boom and recessions, respectively, with macroeconomic risk. The impact of macroeconomic risk on debt overhang depends on the cyclicality of cash flows from assets-in-place and growth opportunities. More cyclical cash flows from the assets-in-place increase the probability that the firm will underinvest during recessions, when marginal utilities are higher, thus amplifying the impact of macroeconomic risk on the agency cost of debt. The effect of more cyclical cash flows from growth opportunities is ambiguous. On the one hand, more cyclical cash flows from growth opportunities increase the probability that firms will underinvest during recessions. On the other hand, the cost from delaying investment in recessions is lower. In our calibrated model, either of the two effects may dominate. What we can infer from this, is that light capital businesses have lower agency cost of debt.
However, their result is not conclusive. Other researchers have found that compared with firms that are mainly composed of invested assets, firms with growth options have higher costs of debt because they are more volatile and have a greater tendency to default during recession when marginal utility is high and recovery rates are low. Their model matches empirical facts regarding credit spreads, default probabilities, leverage ratios, equity premiums, and investment clustering. Firms with growth options are more likely to default in recessions than those without growth options and thus should have higher credit spreads (Arnold, Wagner, & Westermann, 2013).
More work is clearly needed to reconcile such contradicting views.
Nonetheless, what an investor can learn from this is that macroeconomic risks provide high expected return for higher leverage firms that do not default. That is a big “if”, which leads to the necessity of understanding the interaction between liquidity, default, and macroeconomic cycles. In addition, an apt metaphor of investing in equity vs. bond is – investing in equity is investing in a call option that shares the upside of the business; investing in bond is shorting a put option on the assets and fundamentals of the business betting the business does not fail. The agency cost issue tells us that equity holders and bond holders are oftentimes pitted against each other with varying incentive structure that should be heeded when we invest in different layers of a company’s capital structure.
Longstaff, Mithal, and Neis (2005) calculates liquidity risk by subtracting Credit Default Swap (CDS) swap yield from bond yield, because CDS prices mostly reflects the default risk because of their relatively liquid secondary market. There are two types of interaction terms, namely the “liquidity-driven default” and the “default-driven liquidity” components, capturing the endogenous positive spiral between default and liquidity. While the latter is easier to understand, the former, namely “liquidity-driven-default”, is driven by the rollover risk mechanism in that firms rely on infinite-maturity debt financing will default earlier when facing worsening secondary market liquidity (He & Xiong, 2012). Chen, Cui, He, and Milbradt (2018) found that these interaction terms are quantitatively significant across all ratings. They account for 25-30% of the total credit spread of Aaa/Aa rated bonds and 35-40% of the total spread of Ba rated bonds across the two aggregate states. They account for 27% of the spread increase for Aaa/Aa rated bonds and 55% of the spread increase for Ba rated bonds as the economy switches from a normal state into a recession (Chen et al., 2018).

Figure 2. Structural liquidity-default decomposition for 5-year bonds across ratings.
One of the best ways to adapt to various cycles is to pick the right capital allocator at the helm of the company that an investor is interested in. Since the financial crisis of 2008, scholars have found companies cut their investments and payouts in bad times and issues equity in good times even without immediate financing needs, underscoring their salience of the potentiality of financing-window closing as a result of a downward financial cycle. In addition, firms raise capital when their perceived probability of financial conditions worsening (Bolton, Chen, & Wang, 2013). Nevertheless, the aforementioned study along with other studies produce results that challenge recent evidence of the importance of valuation cycles in driving financing waves. In other words, scholars found a positive correlation between equity issuance and stock repurchase waves (Dittmar & Dittmar, 2008). An explanation of buy-back at high valuation is that improved financing conditions raise stock prices and lowers the precautionary demand for cash buffers, which in turn can result in more stock repurchases by cash-rich firms. A majority of firms do not seem to allocate capital optimally, and when companies raise cash for the near term, the primary motive is to prevent themselves from running out of cash. Actually, 62.6% of them would run out of cash in a year, and 81.8% have subnormal cash balances. These equity-issuers are primarily not growth firms, and those companies that fail to issue stocks exhibit poor future performance down the road (DeAngelo, DeAngelo, & Stulz, 2010). These studies showcase the importance and difficulty of becoming partners with great capital allocators given that it seems to be a rare talent. However, investors can take advantage of capital structure dislocation, and a prime example has been my fund’s successful investment in the preferred series of Seritage Growth Properties and its short of its common as a protection back in 2022, which resulted in substantial return on both sides of the trade. In other words, even for the same corporation subjected to identical macro-forces, one could take advantage of misprices between capital layers to exploit excess return.
Conclusion
I have summarized various types of cycles based on their granularity, and I believe, based on an in-depth understanding of these cycles, one would be able to better understand and exploit these cycles for excess profit. In my own professional career, I have been able to capitalize on various cycles (credit cycles, structural commodities cycles, and capital structure cycles) and delivered substantial excess return as a result. Additional work pertaining to aforementioned subjects, particularly regarding capital structure cycles, conflicting views on corporate cycles, and interaction of cycles of various scale can be further analyzed both through case studies and quantitative analytics to arrive at triangulated results to facilitate feasible implementation of investment strategies to extract sustainable alpha from predictably unpredictable cycles of various scale and granularity.
Acknowledgement: I am grateful for the inspiration and encouragement from Prof. Nicole Boyson, the Chairwoman of Northeastern University’s Finance Division, without whom this review article will not be possible to be composed.
References
Arnold, M., Wagner, A. F., & Westermann, R. (2013). Growth options, macroeconomic conditions, and the cross section of credit risk. Journal of Financial Economics, 107(2), 350–385. doi:10.1016/J.JFINECO.2012.08.017
Bolton, P., Chen, H., & Wang, N. (2013). Market timing, investment, and risk management. Journal of Financial Economics, 109(1), 40–62. doi:10.1016/J.JFINECO.2013.02.006
Borio, C., Drehmann, M., & Xia, F. D. (2020). Forecasting recessions: The importance of the financial cycle. Journal of Macroeconomics, 66, Article 103258. doi:10.1016/J.JMACRO.2020.103258
Cerutti, E., Claessens, S., & Rose, A. (2017). How important is the global financial cycle? Evidence from capital flows (NEBR Working Paper 23699). Retrieved from Cambridge, MA: http://www.nber.org/papers/w23699.pdf
Chen, H., Chen, Z., & Li, J. (2021). The debt-equity spread. Retrieved from https://ssrn.com/abstract=3944082
Chen, H., Cui, R., He, Z., & Milbradt, K. (2018). Quantifying liquidity and default risks of corporate bonds over the business cycle. Review of Financial Studies, 31(3), 852–897. doi:10.1093/RFS/HHX107
Chen, H., Dou, W. W., Guo, H., & Ji, Y. (2023). Feedback and contagion through distressed competition (NBER working paper W30841). Retrieved from Cambridge, MA: http://www.nber.org/papers/w30841.pdf
Chen, H., & Manso, G. (2017). Macroeconomic risk and debt overhang. Review of Corporate Finance Studies, 6(1), 1–38. doi:10.1093/RCFS/CFW007
DeAngelo, H., DeAngelo, L., & Stulz, R. M. (2010). Seasoned equity offerings, market timing, and the corporate lifecycle. Journal of Financial Economics, 95(3), 275–295. doi:10.1016/J.JFINECO.2009.11.002
Dittmar, A. K., & Dittmar, R. F. (2008). The timing of financing decisions: An examination of the correlation in financing waves. Journal of Financial Economics, 90(1), 59–83. doi:10.1016/J.JFINECO.2007.11.007
Drehmann, M., Borio, C. E., & Tsatsaronis, K. (2012). Characterising the financial cycle: Don't lose sight of the medium term! (BIS Working Paper No. 380). Retrieved from Basel: https://ssrn.com/abstract=2084835
Drehmann, M., Juselius, M., & Korinek, A. (2018). Going with the flows: New borrowing, debt service and the transmission of credit booms (NBER working paper 24549). Retrieved from Cambridge, MA: https://www.nber.org/papers/w24549
He, Z., & Xiong, W. (2012). Dynamic debt runs. Review of Financial Studies, 25(6), 1799–1843. doi:10.1093/RFS/HHS004
Kapadia, N., & Pu, X. (2012). Limited arbitrage between equity and credit markets. Journal of Financial Economics, 105(3), 542–564. doi:10.1016/J.JFINECO.2011.10.014
Longstaff, F. A., Mithal, S., & Neis, E. (2005). Corporate yield spreads: Default risk or liquidity? New evidence from the credit default swap market. Journal of Finance, 60(5), 2213–2253. doi:10.1111/J.1540-6261.2005.00797.X
Ng, S., & Wright, J. H. (2013). Facts and challenges from the great recession for forecasting and macroeconomic modeling. Journal of Economic Literature, 51(4), 1121–1154. doi:10.1257/JEL.51.4.1120
Passari, E., & Rey, H. (2015). Financial flows and the international monetary system. Economic Journal, 125(584), 675–698. doi:10.1111/ECOJ.12268
Rey, H. (2015). Dilemma not trilemma: The global financial cycle and monetary policy independence (NBER Working Paper 21162). Retrieved from Cambridge, MA: https://www.nber.org/system/files/working_papers/w21162/w21162.pdf
Sandulescu, M., Trojani, F., & Vedolin, A. (2021). Model-free international stochastic discount factors. Journal of Finance, 76(2), 935–976. doi:10.1111/JOFI.12970
Stambaugh, R. F., Yu, J., & Yuan, Y. (2012). The short of it: Investor sentiment and anomalies. Journal of Financial Economics, 104(2), 288–302. doi:10.1016/J.JFINECO.2011.12.001
Supplementary Materials


Letter Correspondence on M&T Bank and Citizen Financial on Oct 30th, 2023.
Dear XXX:
Please allow me to address your question(s) in three parts:
The first part discusses rate hikes and yield curve inversion;
The second part I want to tell you how I got attracted to and become an investor in Citizens;
The last part discusses why I was probably early and what I plan to do with the stake (and why).
Part I:
Before I invested in these regionals, I actually read Wells Fargo's annual reports all the way back into the 70s and 80s (it was a bona-fide regional bank back then, mostly operating in California)
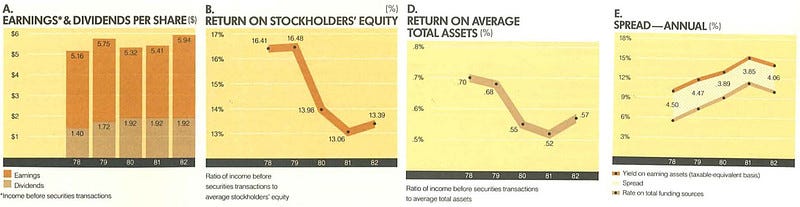
This is from their 1982 annual report. Yes, their NIM, ROE, ROA were all compressed. It was also operating with massive leverage -- unthinkable in today's terms.
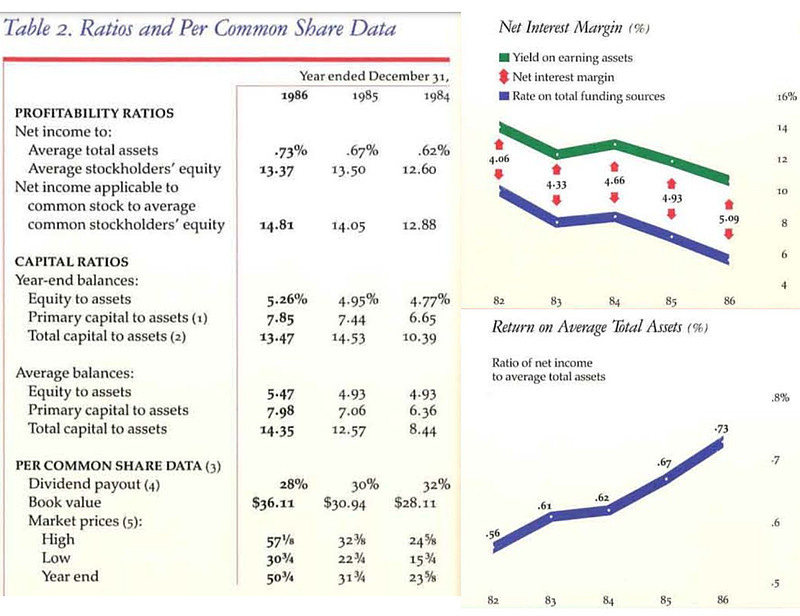
However, when rate declines, the NIM quickly expanded, while ROA, ROE, and profitability skyrocketed. In the next 15 years, this stock will become a 10x. Coupled with its 7% dividend yield, that translates to a 22.5% annualized return.
Of course, the question would be: is the current rate hike cycle ending?
My guess is -- it is. The recent memo from Howard Marks which I circulated earlier discussed this well. Bill Ackman also just closed his short on long-term treasury. Inflation is heading down big-time within a year, and this quarter delinquency further increases. Public debt of $32 trillion simply cannot support a run-away scenario for rates. The entire tax revenue of the US is $4.4 trillion while if we have 10% interest rate it'd be $3.2 trillion additional interest expense within 3 years and I'm not sure how the government is going to sustain that.
Last bit -- just like the market missed the rate curve inversion and pushed these things to north of 2x price to tangible book back in 2021 and later found itself egregiously mistaken, is the market unmistakably accurate in its assessment of the yield curve at this moment? If the market has not been pessimistic, is it possible for the regional banks with strong credit qualities to trade at these levels in the first place?
Part II:
CFG was bought by RBS in 1988 during a period when foreign banks thought the US banking industry is attractive. Since RBS acquired CFG, they expanded it with 25 acquisitions. More than 2 decades later, like many of its peers, RBS decided to exit the US market cuz the business in the US is competitive and they lack scale. They split off CFG and had an IPO of the company at $21.5/share at ~1.1x P/TBV (tangible book value). Since then, CFG has come a long way.
As an independent company, it focused on its business, invested heavily into technology (left side, one of the first bank to migrate to the cloud and develop their own application programming interface for open banking initiatives), and expanded into its consumer banking segment which is lower beta (namely the rise in deposit interest goes up as a smaller % of rate increase)
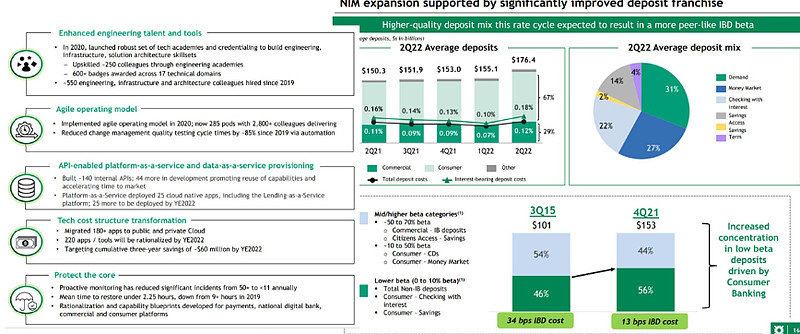
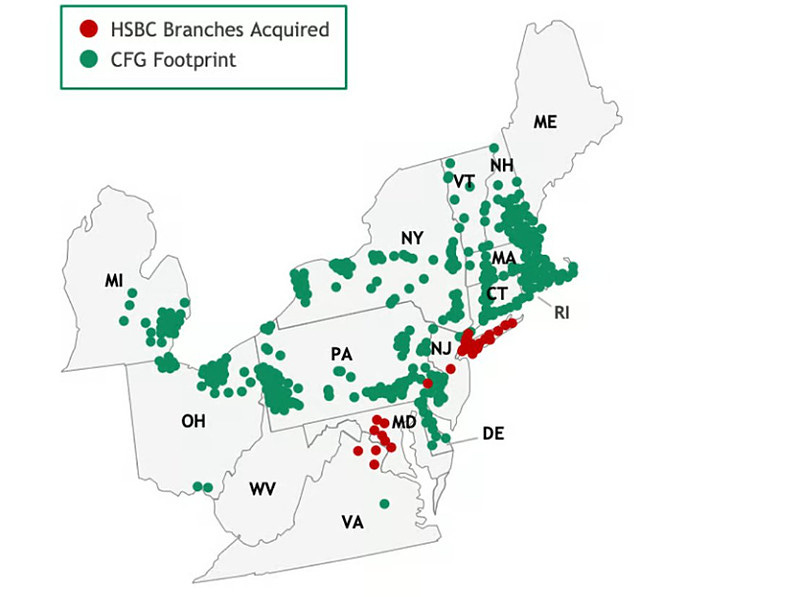
The bank proves to be a shrewd capital allocator, acquiring HSBC's NYC branches' $9 billion deposit for $180 mm. This translates to a 2% deposit premium ($180mm/$9bil). This is a very attractive price in a prosperous (yet also competitive) neighborhood. Similar transactions are typically at 4-7% deposit premium in 2019 when they did the acquisition. After the GFC (great financial crisis) of 08-09, deals were ~2%. So they got a good franchise at depression level valuation. Not bad.
Unliked Silicon Valley Bank or Signature Bank, it managed its duration well. The HTM (held to maturity) and AFS (available for sale) securities losses were small (~5% of tangible book, alternatively, before adjustment for these losses they have a tangible book value of $27.8/share, and with those adjustments they're still $26.5/share), demonstrating again their shrewd capital allocation skill.
As someone who enjoyed using First Republic's services, you may be delighted that Citizens acted in a contrarian fashion and poached 50 experienced private banking professionals from the old First Republic and launched their own Private Banking segment (5 cents of this quarter's earnings were offset by private banking startup costs). In the long term, I think serving wealth clients is the way to go, and coincides with the bank's emphasis on developing close client relationship.
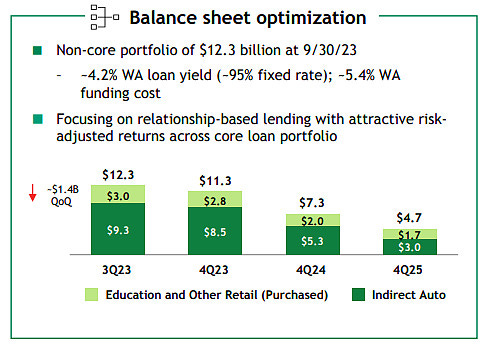
They do not build empires -- in the contrary, they are exiting auto lending because poor profitability and indirect client relationship. I like companies that are willing to walk away from low return businesses.
Last but not least, it's dirt cheap. Their tangible book value by Q3 2023 was less than $28/share. At the current price of $24/share, they're trading at 0.86x tangible book value. Their long-term ROTCE (return on tangible capital employed) target is 16-18%. Even if they are not able to achieve that, and settles around 10-12%, that translates to 11.62%-13.95% annualized return to equity holders -- hardly a bad return. You mentioned their book ROE numbers do not look attractive -- I would point out that their book has $8.3 billion of goodwill and intangibles from the original split-off and later acquisitions (such as the acquisition of HSBC). I would further point out they're trading at 0.47 price to book. Even if we use their book ROE of 8.8%, we're paying less than half of book value, and 8.8%/0.47 = 18.7% -- not bad either.
Part III:
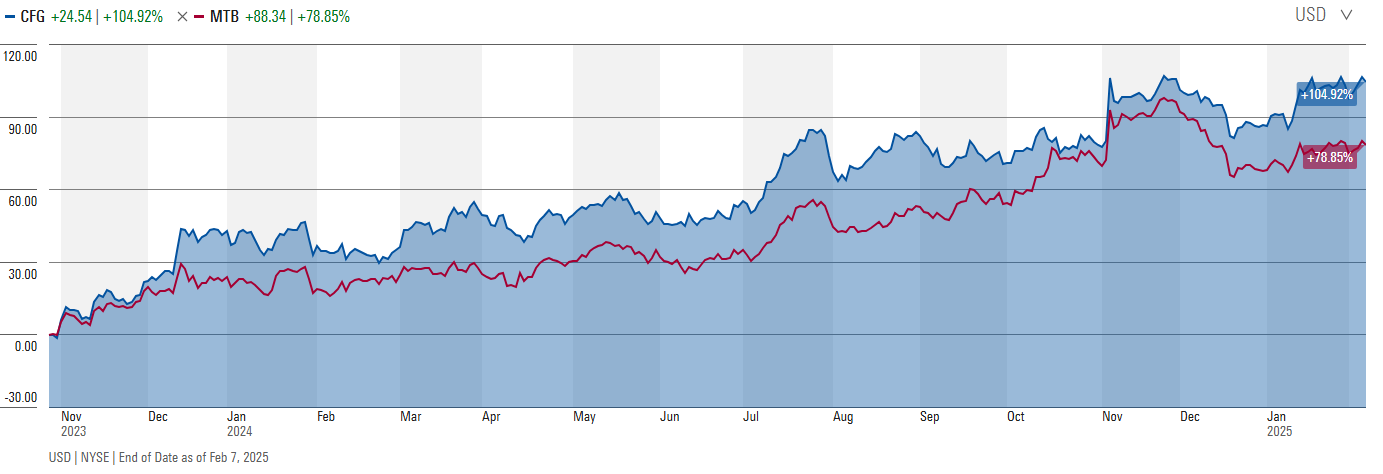
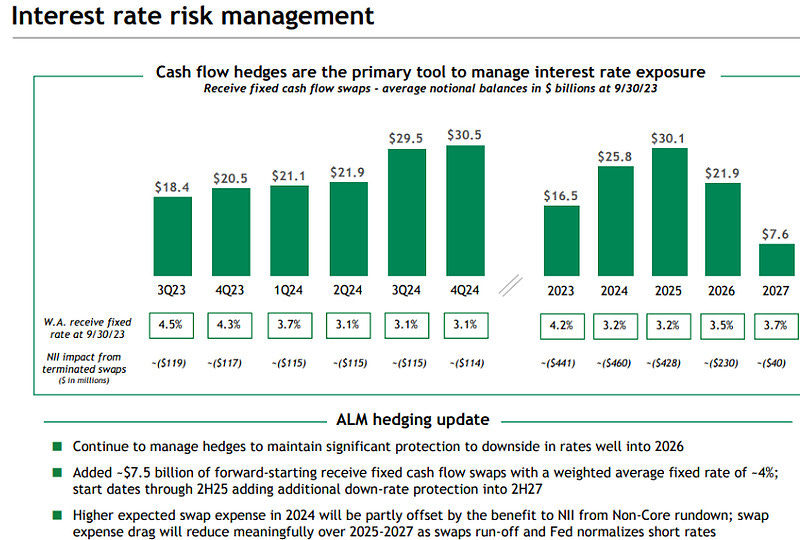
Banks are really tough to invest in because there are so many facets associated with them and missing/misjudging one can lead to adverse outcomes. My clients and I are suffering from a ~10% paper loss from this name because I underestimated the market's reaction to their entrance into a bunch of interest rate swaps (but to the management's credit, they clearly telegraphed this in the last several quarters so the market wasn't probably paying sufficient attention…). Roughly 20% of their loans (mostly commercial loans) are hedged out into 2025... and beyond a 5% interest rate these swaps will be money-losing propositions... The market is understandably frustrated by this... Now that I'm under the water the next question would be -- should I sell? I think 15% discount to tangible book for a strong regional franchise that has a reasonably decent investment track record, coupled with a 7% dividend yield as I am waiting, does not make it a reasonable decision to exit at this point. After the swaps roll off, private banking/wealth management grow, and the Fed tapers off their rate hike, this 7x PE (earnings is depressed) stock may have substantial room to rerate upward. If it goes to $40 (Jan 23 price) by 2028, then I get a 18.3% annualized return. Risks? They have a 10.5% CET I ratio, very limited unrealized losses, conservative lending practices, so I think credit risk is limited even if we enter a mild recession. Given liquidity risk already dissipated (and deposit actually increased sequentially albeit at a slightly higher funding cost), I think this is far-away from a distressed scenario.
Now, are there better options? I actually like M&T bank better on a risk-adjusted basis. They don't have the swap headwinds, managed unrealized losses even better, are managed by a star team led by Rene Jones, one of the best bankers alive who masterminded the tremendously accretive deal of Wilmington Trust acquisition during the GFC (he was the CFO back then, working with Bob Wilmer), currently trading at <1.2x price to tangible book (due to CRE fear, which I think is overblown, at least for M&T bank — fingers crossed I'm right), and has a remarkable track record (the only bank that maintained and then hiked dividend during the GFC). The bank has been a 100x from 1980s to 2007, and has been flat to down from 2007-2023 despite its tangible book value close to tripling over that time period. I think it's ready for the next move up to permanently kiss goodbye to the low $100s level. My clients and I hold M&T bank as one of our largest holdings.
Hope it helps to some degree and look forward to discussing more either through email or during our next meeting,